Recently Viewed ›
Recently Downloaded 
Close x

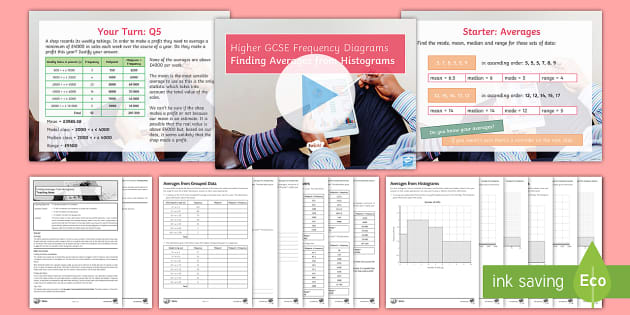
This resource challenges pupils to combine their knowledge of finding averages from grouped data with what they know about histograms. They will revisit how to find the mean, mode and median from a grouped data set as well as how to extract this same information from a histogram. This pack contains a teaching PowerPoint, worksheet and lesson plan.
hi do you have Higher Maths Frequency Diagrams Lesson 5? lesson no 5 is missing
Hello tutyas,
Thanks for getting in touch. I've taken a look and I think this resource might be what you had in mind! Please do let me know if it's not what you were looking for. https://www.twinkl.co.uk/resource/t4-m-138-drawing-and-interpreting-box-plots-lesson-pack
 Georgia.T6520@Twinkl 4 years ago